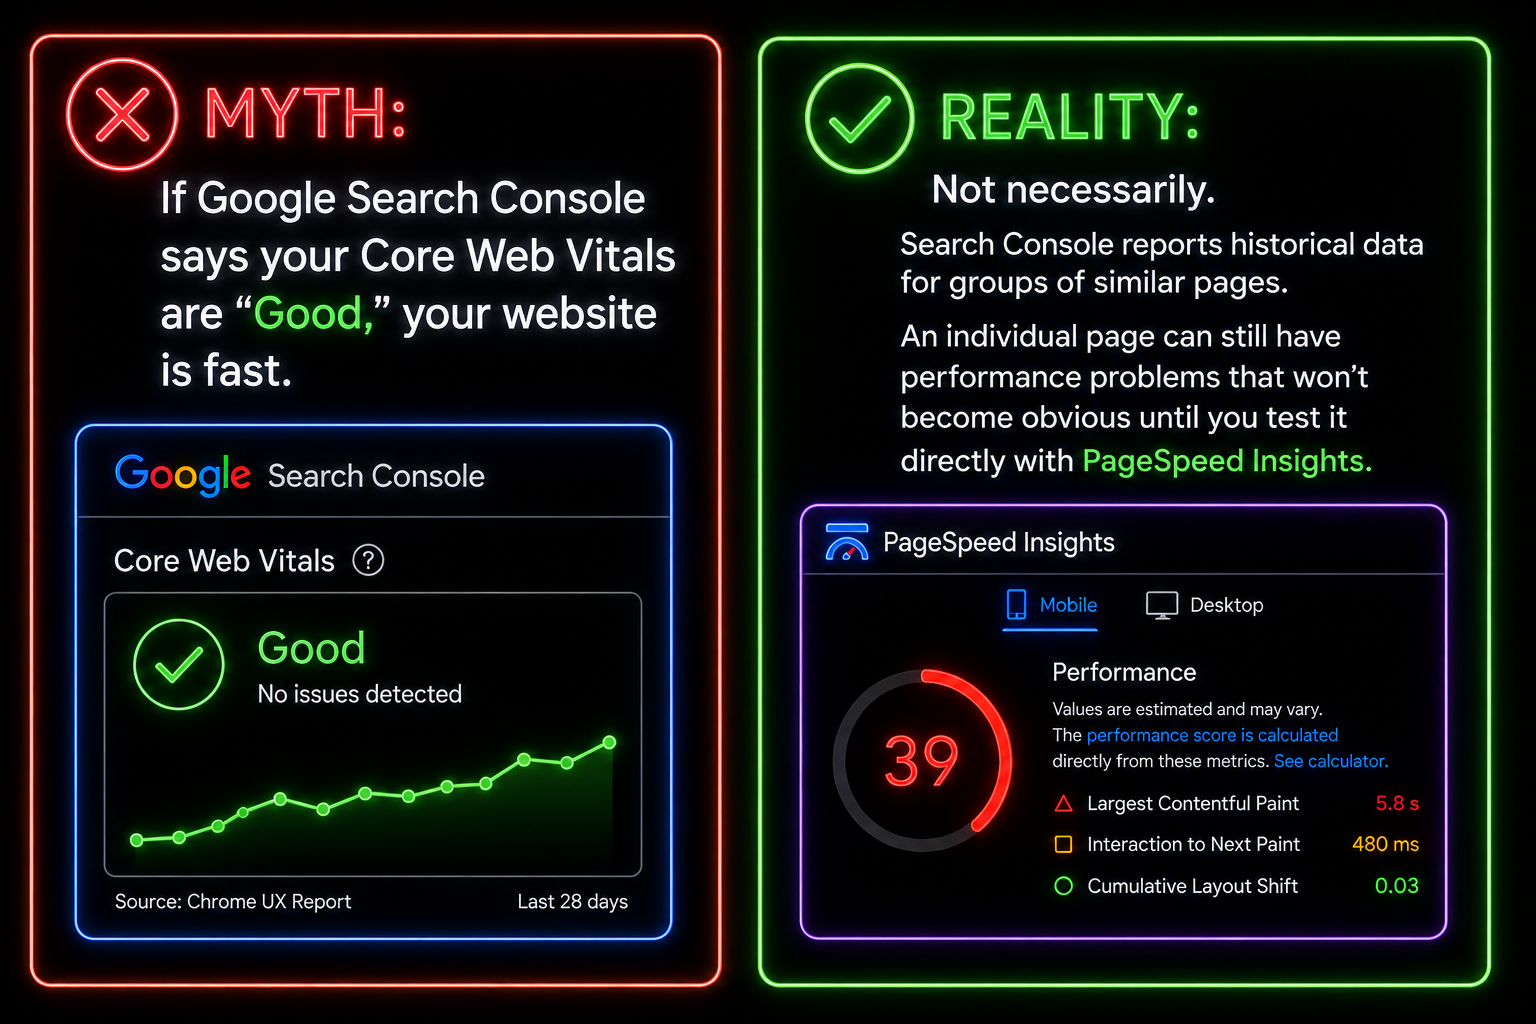
Your Google Search Console report says your Core Web Vitals are “Good.” Then you run one of those same pages through Google PageSpeed Insights and discover it takes more than 17 seconds for the largest piece of content to load on mobile.
How can both be true?
The answer is that Google Search Console and PageSpeed Insights aren’t measuring the same thing. Search Console uses real-user data collected over 28 days to monitor performance trends across groups of similar pages, while PageSpeed Insights analyzes individual pages using a combination of real-user data (when available) and a real-time Lighthouse test.
Because of that, Search Console can report that a group of pages is performing well overall even if an important landing page is loading slowly or struggling on mobile.
Because Core Web Vitals are part of Google’s page experience signals, improving them can support your broader SEO efforts alongside quality content, technical SEO, and strong backlinks.
TL;DR
No need to scroll unless you want expert advice. This is pretty much everything you need to know.
- Google Search Console and PageSpeed Insights aren’t measuring the same thing. Search Console reports 28 days of real-user data grouped across similar pages. PageSpeed Insights analyzes one URL in real time. Both can say different things about the same page and both can be right.
- Only three metrics feed Google’s ranking systems: LCP under 2.5 seconds, INP under 200 milliseconds, and CLS under 0.1, measured at the 75th percentile of real visits.
- The 0 to 100 Lighthouse score is not a ranking factor. Total Blocking Time is 30% of that score and 0% of the ranking signal. It’s a diagnostic tool, not a scoreboard.
- Core Web Vitals are pass/fail, not a curve. Fix whatever sits closest to a threshold, and stop optimizing once a metric is green and stable.
- LCP is where most sites fail. Only 62% of mobile origins clear it, versus 77% for INP and 81% for CLS. Fix LCP first, take the cheap CLS wins, and don’t ignore INP.
- Test mobile, not desktop. Google indexes the mobile version of your site first, regardless of where your traffic comes from.
- Use both tools. Search Console to monitor trends across your site, PageSpeed Insights to diagnose individual pages.
What Are Core Web Vitals and Why Do They Matter for SEO?
Core Web Vitals are Google’s standardized measurements for evaluating how users experience a webpage.
Rather than focusing solely on content relevance, Google also wants to understand whether visitors can access that content quickly, interact with it smoothly, and use it without unexpected visual disruptions.
Today, Google’s three official Core Web Vitals are:
- Largest Contentful Paint (LCP) measures loading performance.
- Interaction to Next Paint (INP) measures responsiveness after a visitor interacts with a page.
- Cumulative Layout Shift (CLS) measures visual stability.
These metrics are part of Google’s broader page experience signals. They’re not the most important ranking factor—high-quality, relevant content still comes first—but they can become a deciding factor when several pages provide similarly useful information.
Think of it this way: If two companies publish equally helpful articles answering the same question, Google would rather send users to the page that’s faster, more responsive, and easier to use.
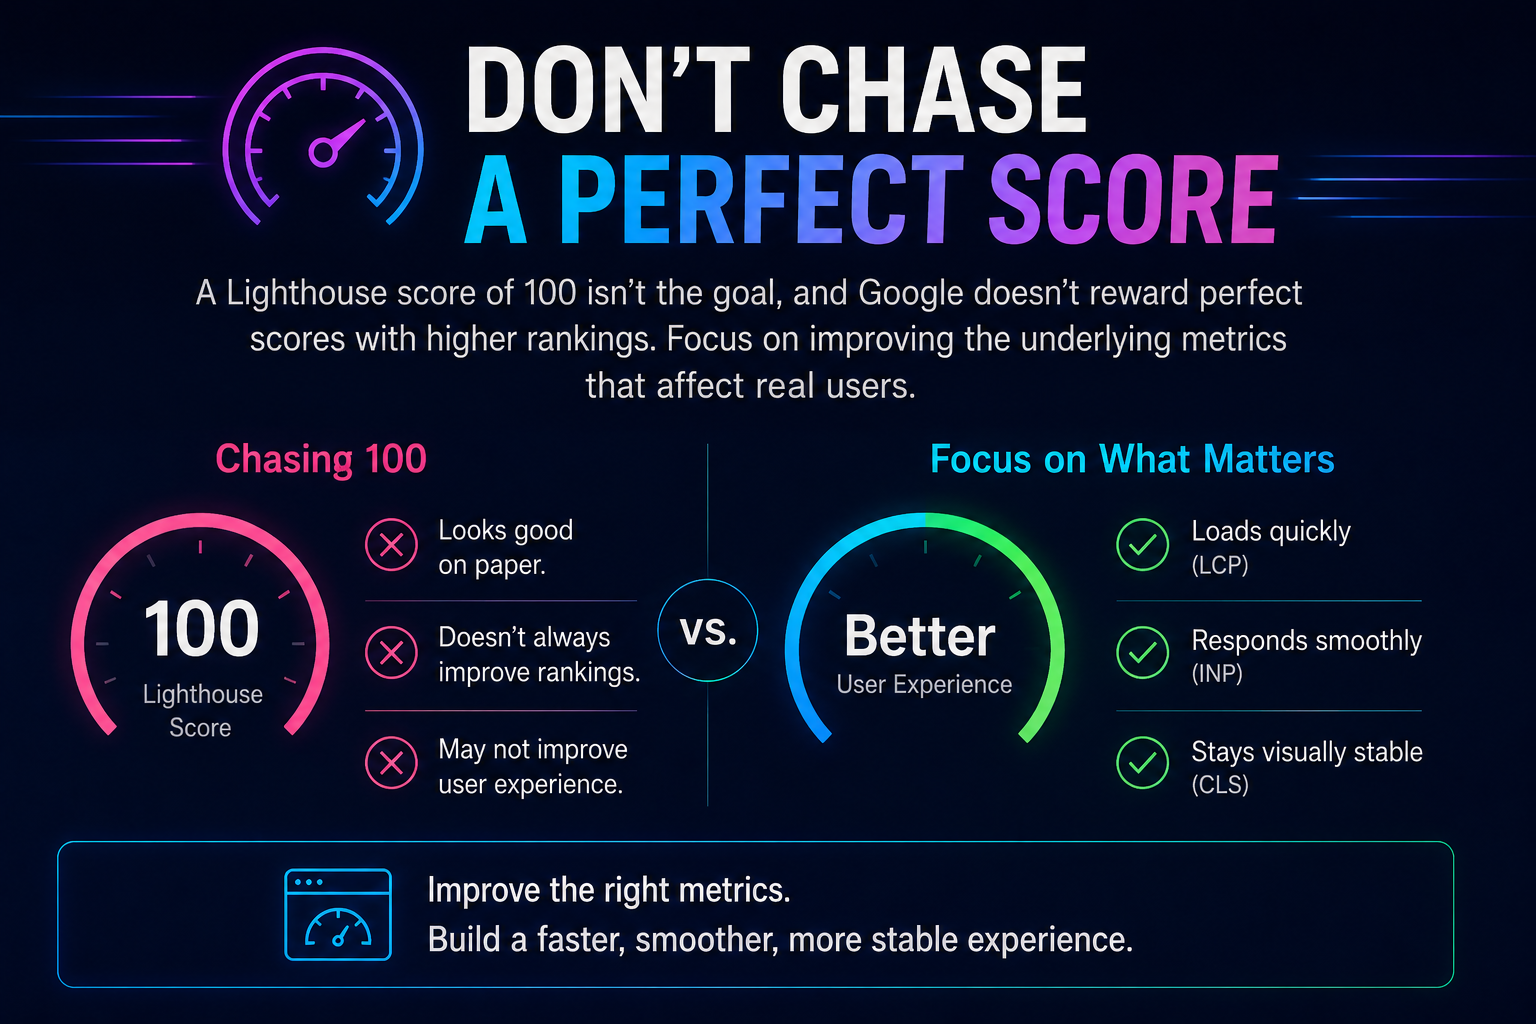
That doesn’t mean you need perfect scores. Google has repeatedly stated that there isn’t a special ranking bonus for earning a perfect 100 in Lighthouse. Instead, the goal is to provide a consistently fast, stable experience for real users.
Understanding Your Core Web Vitals & PageSpeed Insights Metrics
Core Web Vitals get most of the attention, but they’re only part of the performance report you’ll see in PageSpeed Insights. Google also includes several additional metrics that help explain why a page received its score.
Some of these metrics are official ranking signals, while others are diagnostic tools. Together, they provide a much more complete picture of how visitors experience your site.
| Metric |
What It Measures |
Good |
Needs Improvement |
Poor |
| Largest Contentful Paint (LCP) |
Time until the largest visible element loads |
<2.5 s |
2.5–4.0 s |
>4.0 s |
| First Contentful Paint (FCP) |
Time until the first visible content appears |
<1.8 s |
1.8–3.0 s |
>3.0 s |
| Total Blocking Time (TBT) |
Time the browser can’t respond to user input |
<200 ms |
200–600 ms |
>600 ms |
| Cumulative Layout Shift (CLS) |
Visual stability during page load |
<0.1 |
0.1–0.25 |
>0.25 |
| Speed Index |
How quickly visible content appears |
<3.4 s |
3.4–5.8 s |
>5.8 s |
Let’s look at what each metric actually tells you.
Largest Contentful Paint (LCP)
Largest Contentful Paint measures how long it takes for the largest visible element on a page to finish loading. That’s often a hero image, large heading, or featured image near the top of the page.
LCP is one of the clearest indicators of perceived page speed. Even if smaller elements load first, visitors generally don’t feel like the page is ready until the main content appears.
A poor LCP score is often caused by:
- Large, unoptimized images
- Slow server response times
- Render-blocking JavaScript or CSS
- Too many third-party resources loading before the main content
Google considers an LCP under 2.5 seconds good. Anything over 4 seconds falls into the poor range.
First Contentful Paint (FCP)
First Contentful Paint measures how long it takes for the browser to display the first visible piece of content. That might be text, an image, or another page element.
FCP doesn’t tell you when the page is fully loaded, but it does influence how fast the site feels. A page that starts rendering quickly is usually perceived as faster than one that shows a blank screen for several seconds.
Common causes of poor FCP include slow hosting, render-blocking resources, and large CSS or JavaScript files that delay rendering.
A good FCP is under 1.8 seconds, while anything above 3 seconds is considered poor.
Total Blocking Time (TBT)
Total Blocking Time measures how long the browser is too busy to respond to user input while the page is loading.
Although TBT isn’t an official Core Web Vital, it’s an important diagnostic metric because it often points to the same issues that affect Interaction to Next Paint (INP), Google’s official responsiveness metric.
Heavy JavaScript is usually the biggest culprit. Analytics scripts, chat widgets, advertising tags, and other third-party tools can all increase blocking time if they require significant processing before the page becomes interactive.
Google recommends keeping TBT below 200 milliseconds. Scores above 600 milliseconds indicate that users may experience noticeable delays when trying to interact with the page.
Cumulative Layout Shift (CLS)
Cumulative Layout Shift measures how much a page moves around while it’s loading.
If you’ve ever tried to click a button only to have it shift just before you clicked, you’ve experienced a layout shift. It’s frustrating for users and can make a page feel unreliable even if it loads quickly.
The most common causes include:
- Images without defined dimensions
- Embedded videos or ads that load after the page begins rendering
- Dynamically inserted content
- Web fonts that cause text to reflow
A CLS score below 0.1 is considered good. Anything above 0.25 is poor.
Speed Index
Speed Index measures how quickly visible content appears throughout the loading process.
Unlike LCP or FCP, which focus on specific milestones, Speed Index looks at the overall visual progression of the page. Lower scores generally indicate that users see meaningful content sooner.
While Speed Index isn’t an official Core Web Vital, it can help explain why a page feels slow even when other metrics look reasonable.
Google considers a Speed Index below 3.4 seconds good. Scores above 5.8 seconds indicate there’s room for improvement.
How Are Each of the Web Vitals Weighted?
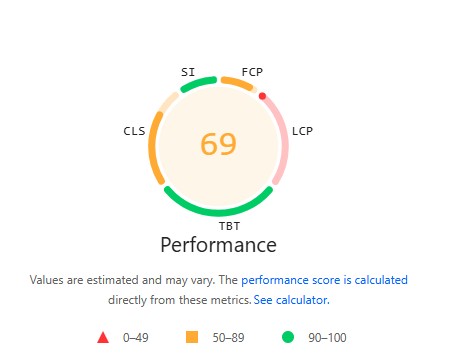
Ask which metric deserves your attention and you’ll get two different answers, because there are two different scoring systems in play. The 0 to 100 performance score in PageSpeed Insights is a weighted average of five lab metrics, here’s the exact formula:
| Metric |
Weight in Lighthouse Score |
| Total Blocking Time (TBT) |
30% |
| Largest Contentful Paint (LCP) |
25% |
| Cumulative Layout Shift (CLS) |
25% |
| First Contentful Paint (FCP) |
10% |
| Speed Index (SI) |
10% |
This is what trips people up: that score isn’t a ranking factor. It’s a lab simulation run once from Google’s servers.
What Google actually uses in its ranking systems is field data from real Chrome users, and it looks at only three metrics: LCP at 2.5 seconds or less, INP at 200 milliseconds or less, and CLS below 0.1. There’s no weighted average involved. Each one is assessed independently, pass or fail, at the 75th percentile of real visits.
So TBT carries 30% of a score Google doesn’t rank on and 0% of the signal it does. It still matters, but only as a lab proxy for INP, which is the metric that counts.
That pass/fail structure should change how you prioritize. Moving LCP from 5.0 seconds to 3.2 seconds is a real engineering win that does nothing for your ranking signal, because you’re still failing.
Moving it from 2.7 to 2.4 is a far smaller change that flips the metric to passing. The reverse holds too: once a metric is comfortably green, further optimization buys you nothing.
Work on whatever sits closest to a threshold rather than whatever looks worst, and stop when it’s stable.
As for where the real problem usually lives, HTTP Archive’s analysis of real Chrome user data found that only 48% of mobile sites pass all three Core Web Vitals, and LCP is the metric holding that number down. Just 62% of mobile origins clear it, compared to 77% for INP and 81% for CLS.
If you fix one thing, fix LCP!
CLS is the cheapest win and usually comes down to images without dimensions, ads that inject after render, and fonts that reflow text, so take those hours regardless.
INP is the one most teams skip, and it’s the most dangerous omission. It replaced First Input Delay in March 2024 and measures responsiveness across the entire visit instead of just the first click, so plenty of sites that passed the old metric are quietly failing the new one.
And before you blame your server, check your Time to First Byte. If it’s already under 800 milliseconds, your LCP problem is in the asset pipeline, not the hosting.
Rankings aren’t even the strongest argument for doing this work. Vodafone Italy A/B tested two identical landing pages where the only difference was a 31% better LCP in the field.
The faster page produced 8% more sales, a 15% better lead-to-visit rate, and an 11% better cart-to-visit rate. No design change, no new copy, no extra traffic. Insane to think that speed is a conversion factor… huh.
Core Web Vitals are a modest tiebreaker in search, but the user behavior they measure shows up in your conversion rate whether Google cares or not.
Why Mobile Comes First (Even If Most of Your Visitors Use Desktop)
It’s easy to assume desktop performance matters most if that’s where most of your traffic comes from. In reality, Google primarily evaluates the mobile version of your site.
That’s because Google uses mobile-first indexing. When Google crawls and indexes your website, it looks at the mobile version of your pages first. If your mobile experience is slow, difficult to use, or missing content that’s available on desktop, it can affect how your pages are evaluated in search.
That doesn’t mean desktop performance is irrelevant. It still affects your visitors and conversion rates. But from an SEO perspective, mobile performance deserves your attention first.
A Real Example
To illustrate the point, we ran the bgood media homepage through PageSpeed Insights using Google’s mobile device emulation.
The results weren’t flattering, but they were a good reminder that no website is ever truly “finished.”
| Metric |
Result |
| Performance Score |
39 |
| First Contentful Paint |
7.9 s |
| Largest Contentful Paint |
17.3 s |
| Total Blocking Time |
750 ms |
| Cumulative Layout Shift |
0 |
| Speed Index |
7.9 s |
Nearly every loading metric fell into the poor range. The exception was Cumulative Layout Shift, which scored perfectly because the page remained visually stable while loading.
We chose to include these results for a reason. Website performance changes over time. New content gets published, plugins are installed, scripts are added, and design updates introduce new assets. Even websites maintained by digital marketing agencies need regular performance reviews.
If we had only looked at desktop performance, we would have missed some of the biggest issues affecting the mobile experience.
That’s why it’s a good idea to test your most important pages on mobile before and after major website updates. Small changes can have a bigger impact than you might expect.
Google Search Console vs. PageSpeed Insights
One of the biggest sources of confusion around Core Web Vitals is the difference between Google Search Console and PageSpeed Insights.
Although both tools use Google’s data, they answer different questions.
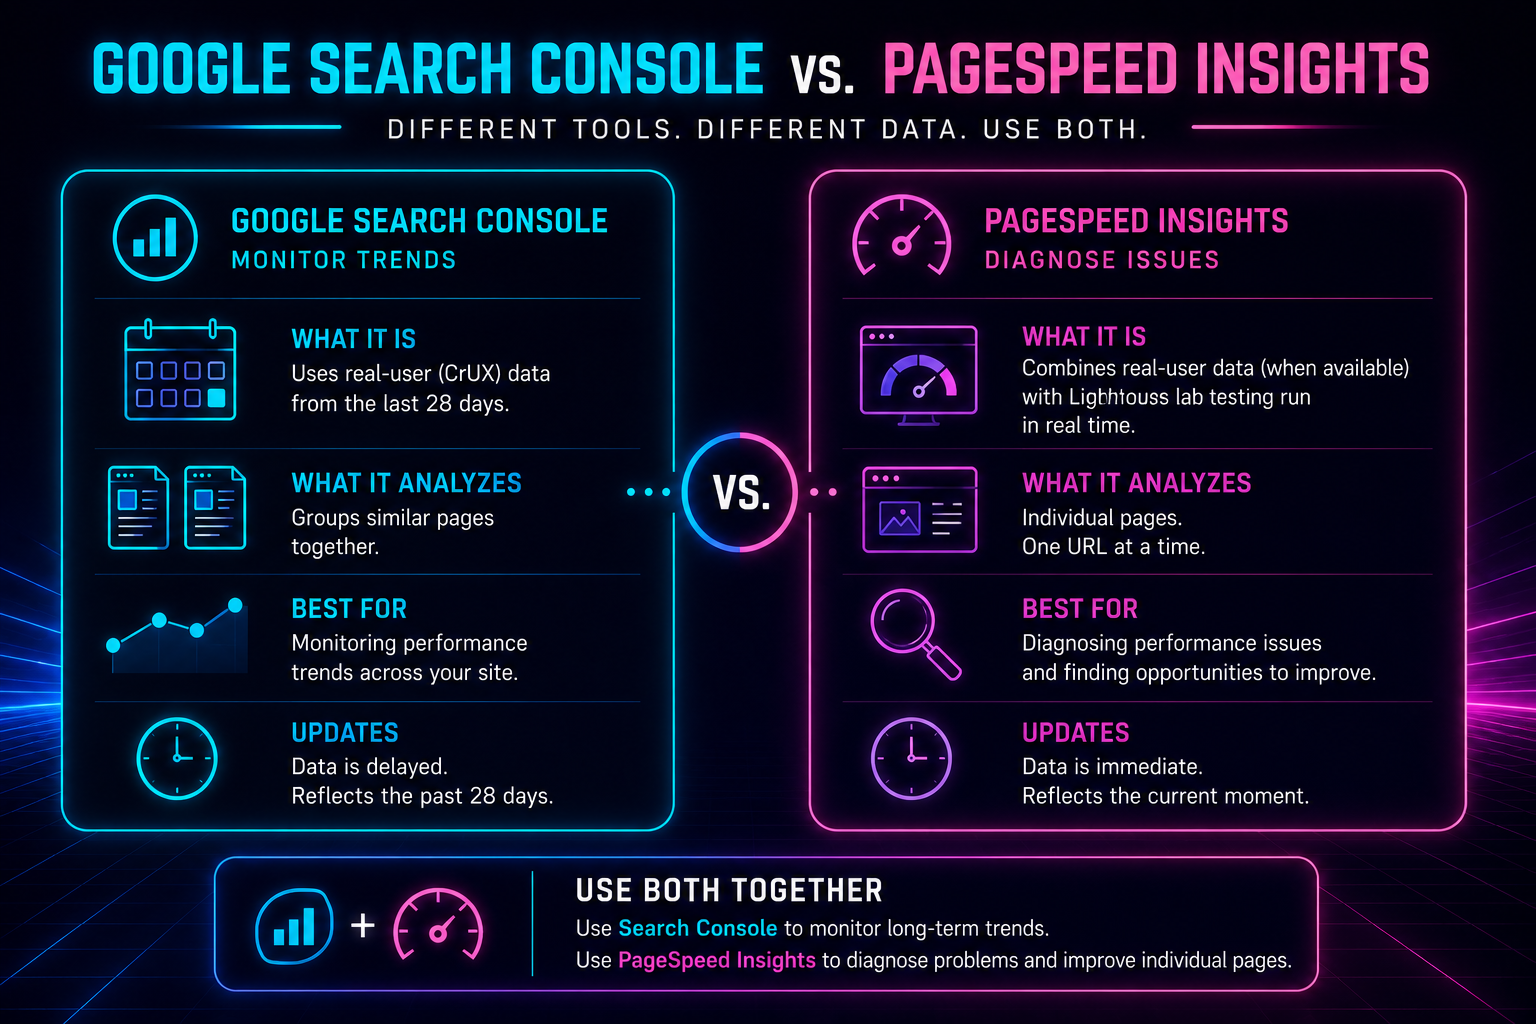
Google Search Console Shows Long-Term Trends
The Core Web Vitals report in Google Search Console is based on data collected from real Chrome users over the previous 28 days.
That makes it a valuable monitoring tool. If a group of pages starts performing worse over time, Search Console will usually show the trend. The tradeoff is that the data isn’t immediate.
Search Console also groups similar pages together instead of reporting on every URL individually. A problem affecting one page may not appear if the rest of the group is performing well. Likewise, a recent change won’t show up right away because the report is based on historical data.
For those reasons, Search Console is best used to monitor the overall health of your website, not to troubleshoot individual pages.
PageSpeed Insights Helps You Diagnose Problems
PageSpeed Insights takes a different approach, which gives you immediate feedback.
Instead of looking at groups of pages, it analyzes a single URL. The report combines available field data from real users with a Lighthouse test performed when you run the analysis.
If you optimize an image, remove a script, or update your code, you can rerun the test and see how those changes affected the page. The report also highlights opportunities and diagnostics that help identify what’s slowing the page down.
For page-level analysis, it’s the more useful tool.
The two tools work best together.
Use Google Search Console to monitor trends across your website.
Use PageSpeed Insights when you want to understand why a specific page is underperforming and what you can do to improve it.
Other Tools for Measuring Core Web Vitals
PageSpeed Insights should be your primary tool for evaluating page performance, but it isn’t the only one worth using. Depending on your role, other tools can provide additional context or make ongoing monitoring easier.
PageSpeed Insights
For most marketers and business owners, PageSpeed Insights is the best place to start. It analyzes individual pages, combines available field data with Lighthouse testing, and identifies specific opportunities to improve performance. It also lets you compare mobile and desktop results, making it easy to spot issues that might otherwise go unnoticed.
Chrome DevTools and Lighthouse
Chrome DevTools includes Lighthouse, Google’s open-source performance auditing tool. Developers often use it while building or updating websites because it allows them to test pages before changes go live.
DebugBear
DebugBear builds on Lighthouse testing by adding historical tracking and ongoing monitoring. If you’re responsible for maintaining a large website, it’s a useful way to see how performance changes over time and catch issues after deployments.
WebPageTest
WebPageTest provides more advanced performance testing, including waterfall charts that show exactly how a page loads. It’s more technical than PageSpeed Insights, but it can be invaluable when developers need to pinpoint specific bottlenecks.
CrUX Dashboard
The Chrome User Experience (CrUX) Dashboard uses Google’s real-user data to track performance trends at the domain level. It’s helpful for identifying long-term improvements or declines but isn’t designed to diagnose individual pages.
Google Search Console
Google Search Console still belongs in your toolkit. Its Core Web Vitals report is useful for spotting patterns across your website and identifying groups of pages that may need attention. Just remember that it’s a monitoring tool, not a real-time diagnostic tool.
How to Improve Your Core Web Vitals
You don’t need to rebuild your website to improve Core Web Vitals. In many cases, a handful of targeted optimizations can make a noticeable difference.
Start with the biggest opportunities.
Compress and Optimize Images
Large images are one of the most common causes of poor Largest Contentful Paint scores. Compress images before uploading them, serve appropriately sized versions, and use modern formats like WebP whenever possible.
Remove or Defer Render-Blocking JavaScript
Scripts that load before your content can delay rendering and increase both FCP and LCP. Deferring non-essential JavaScript allows the browser to display important content sooner.
Enable Lazy Loading
Images and videos below the fold don’t need to load immediately. Lazy loading reduces the amount of data downloaded during the initial page load, improving performance without affecting the user experience.
Reserve Space for Images, Ads, and Embeds
Unexpected layout shifts are usually preventable. Define image dimensions and reserve space for ads, videos, and embedded content so the page layout remains stable as resources load.
Improve Server Response Times
A slow server can affect almost every performance metric. Faster hosting, better caching, and a content delivery network (CDN) can all reduce load times, especially for visitors who are far from your server.
Review Third-Party Scripts
Analytics tools, chat widgets, advertising tags, heat maps, and other third-party scripts all add work for the browser. Audit them regularly and remove anything that’s no longer providing value.
Test Mobile Performance After Every Major Update
Don’t wait until rankings drop to check your Core Web Vitals. Make it a habit to run PageSpeed Insights on your most important pages every month (and after any major website update).
Common Questions We’re Asked
I fixed my LCP. Why does Search Console still say the page is failing?
Because Search Console runs on a 28-day rolling window of real-user data. Your fix has to age into that window before the report moves, so expect roughly four weeks before the status flips (and longer if the page gets little traffic). PageSpeed Insights will show the improvement immediately in its lab test. Use that for confirmation and stop refreshing Search Console daily.
Why does my PageSpeed score change every time I run the test?
Because the score comes from a single simulated load on Google’s hardware, and that load competes with whatever else is happening on the server at that moment. Swings of 5-10 points between runs are normal. Run it three times and take the middle result. If you are chasing a 4-point difference, you are optimizing noise.
My report says there is no field data for this page. What does that mean?
It means not enough Chrome users visited that URL for Google to build a real-user dataset, so you are seeing lab results only. Google usually falls back to origin-level data for the whole domain. That is fine for diagnosis, but remember the ranking signal comes from field data, so a page with none is being judged by the origin’s numbers.
Search Console says my Core Web Vitals assessment failed. What do I fix first?
Open the report, sort by the URL group with the most affected pages, and check which of the three metrics is failing. Fix whichever one sits closest to its threshold rather than whichever looks worst. Then confirm the fix on a single URL in PageSpeed Insights before rolling it out sitewide. Validating one page is faster than validating 50.
I am on WordPress. What usually causes bad Core Web Vitals?
Four things, in this order: a page builder loading far more CSS and JavaScript than the page uses, uncompressed hero images, too many plugins each adding their own scripts, and cheap shared hosting inflating server response time. Audit your plugins first, as it is the fastest win and it costs nothing but an afternoon.
Will a caching plugin or a CDN fix this on its own?
Partly. Caching and a CDN mainly improve server response time and Time to First Byte, which helps LCP if that is your bottleneck. Neither one shrinks an oversized hero image, defers a render-blocking script, or reserves space for an ad that shifts your layout. They are a real step, not a substitute for fixing the page itself.
Do Core Web Vitals matter for AI search and GEO?
Indirectly, and more than people assume. AI systems have to crawl and render your page before they can cite it, and a slow, script-heavy page is a page that gets crawled less thoroughly. Speed is not a GEO ranking factor, but a fast, clean, well-structured page is easier for every crawler to read, whether it is human-facing or not.
Can I fix this myself, or do I need a developer?
Image compression, lazy loading, plugin cleanup, and setting explicit image dimensions are all within reach of a non-developer. Deferring render-blocking JavaScript, cutting unused CSS, and diagnosing third-party script conflicts usually are not. Do the first list yourself, measure again, and only bring in a developer for whatever is still failing.
How do I justify this work to a boss or client who does not care about scores?
Do not lead with the score, because it is not a ranking factor and they will rightly ask why it matters. Lead with revenue. Vodafone Italy tested two identical landing pages differing only in LCP and the faster one produced 8% more sales. Frame the work as conversion optimization that happens to help SEO.
Should I test my homepage or my other pages?
Other pages. Homepages get tested constantly and fixed first, while the product and landing pages that actually convert get ignored. Pick your top five pages by revenue or leads, test each on mobile, and start there. Your homepage score is the one least likely to be costing you money.
Conclusion
Core Web Vitals are about more than improving a performance score. They’re about creating a website that’s fast, responsive, and easy to use.
They also strengthen the technical foundation that supports broader search visibility, including both traditional SEO and Generative Engine Optimization (GEO).
If you take away one thing from this article, it should be this: Google Search Console is ideal for monitoring long-term trends across your website, while PageSpeed Insights is the better choice for evaluating individual pages and identifying opportunities for improvement. Using both gives you a more complete picture of your site’s performance.
If you haven’t tested your most important pages recently, start with a mobile PageSpeed Insights report. You may find everything is performing well, or you may uncover opportunities to improve your site’s speed, usability, and search visibility.
Need help improving your Core Web Vitals? Our team can identify performance bottlenecks and help you build a faster, more search-friendly website. Reach out today!